Published: 2024-04-15T15:23:39.000Z
Chart USD/CAD Update: Fresh 20524 high - studies remain positive

Senior Technical Strategist
1
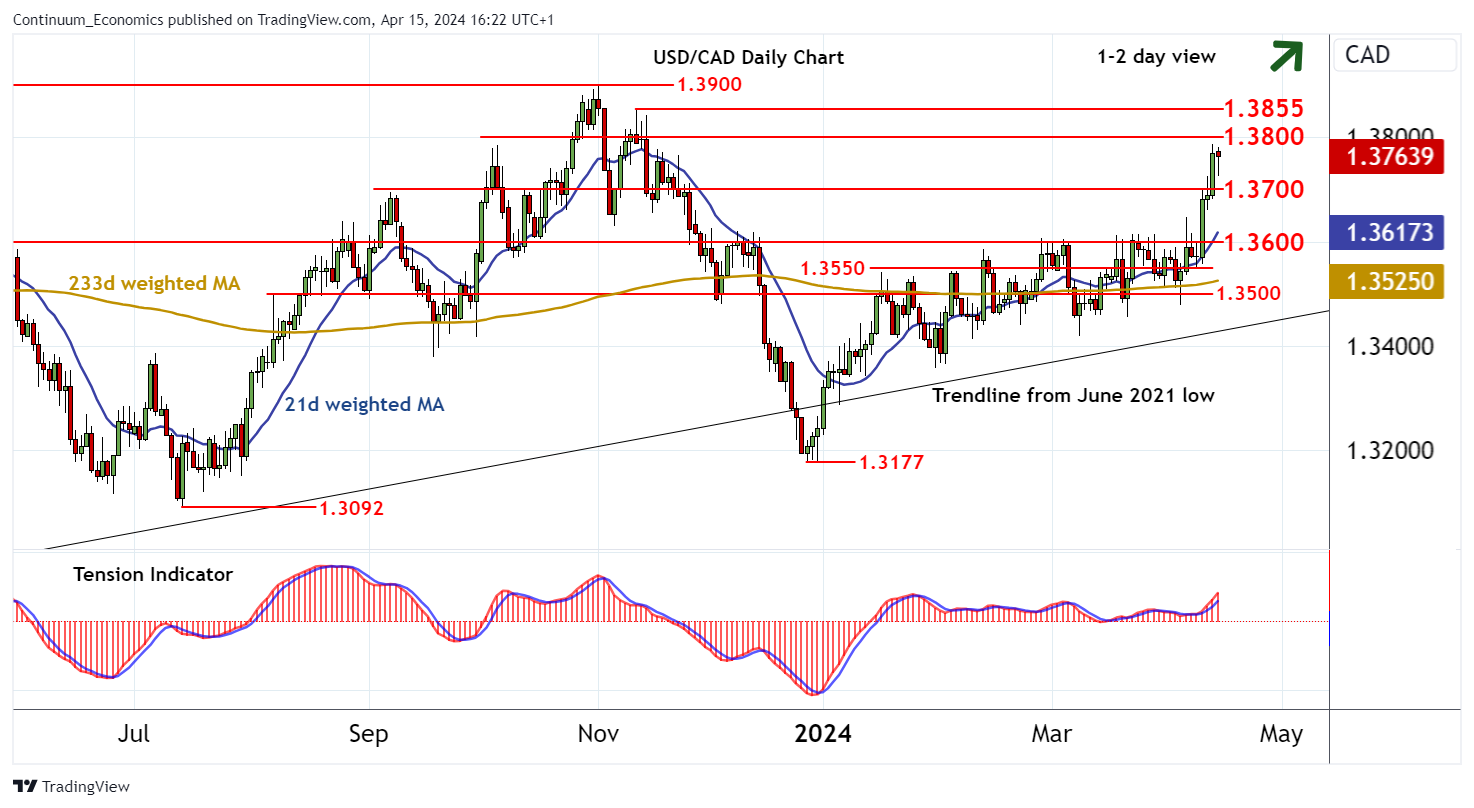
Late-December gains have extended to a fresh year high at 1.3787
| Levels | Imp | Comment | Levels | Imp | Comment | |||
|---|---|---|---|---|---|---|---|---|
| R4 | 1.3900 | ** | 1 Nov 2023 YTD high | S1 | 1.3700 | ** | congestion | |
| R3 | 1.3855 | * | 10 Nov (w) high | S2 | 1.3650 | congestion | ||
| R2 | 1.3800 | ** | congestion | S3 | 1.3600 | ** | break level | |
| R1 | 1.3787 | 12 Apr YTD high | S4 | 1.3500 | * | congestion |
16:15 BST - Late-December gains have extended to a fresh year high at 1.3787, where negative intraday studies and flattening overbought daily stochastics are prompting short-term reactions. The daily Tension Indicator continues to rise and broader weekly charts are also improving, suggesting room for still further strength in the coming sessions. A later close above congestion resistance at 1.3800 will turn price action positive once again and initially open up the 1.3855 weekly high of 10 November. Meanwhile, support remains ast congestion around 1.3700. An unexpected close beneath here will add weight to sentiment and prompt fresh consolidation above 1.3600.