Chart USD/TRY Update: Back at highs, but long-term studies under pressure

Anticipated corrective losses have not been seen, as consolidation gives way to a fresh drift higher
| Levels | Imp | Comment | Levels | Imp | Comment | |||
| R4 | 35.0000 | * | figure | S1 | 32.0000 | * | congestion | |
| R3 | 34.0000 | * | figure | S2 | 31.7390 | * | 21 Mar (w) low | |
| R2 | 33.0000 | * | figure | S3 | 31.3500 | * | 1-4 Mar break level | |
| R1 | 32.4450 | ** | 1 Apr all time high | S4 | 31.0000 | * | figure |
Asterisk denotes strength of level
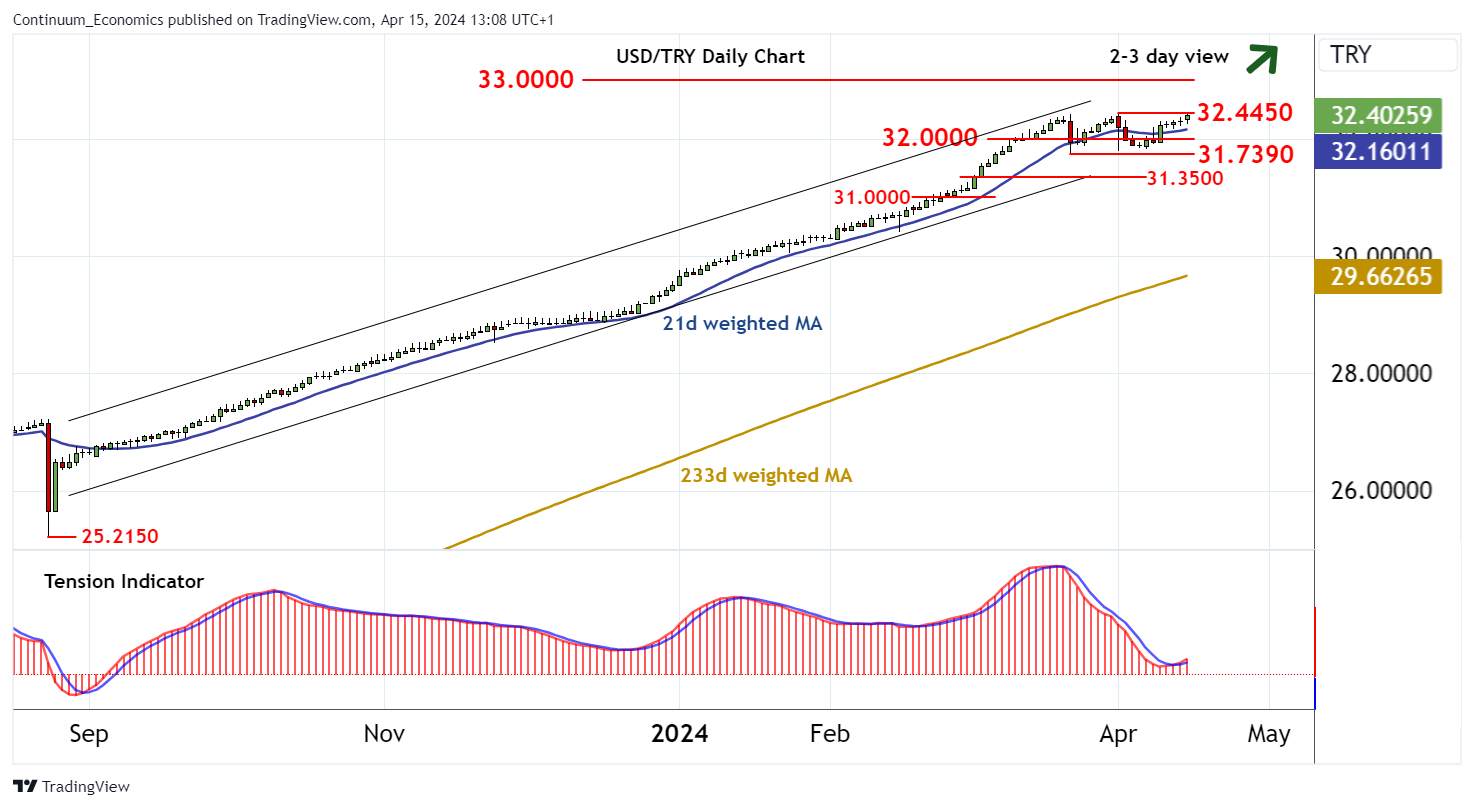
12:50 BST - Anticipated corrective losses have not been seen, as consolidation gives way to a fresh drift higher to pressure the 32.4450 all time high of 1 April. Daily studies have turned positive, suggesting potential for a break above here and continuation of long-term bullish trends. However, weekly charts are under pressure and broader monthly readings have turned mixed/negative, highlighting a cautious tone into any immediate break. Meanwhile, support is raised to congestion around 32.0000. A close beneath here would add weight to sentiment. But a further close below the 31.7390 weekly low of 21 March is needed to turn sentiment outright negative and signal a deeper pullback.