Chart USD/ZAR Update: Testing strong resistance at 19.0000 - 19.1050

Consolidation has given way to the anticipated break higher
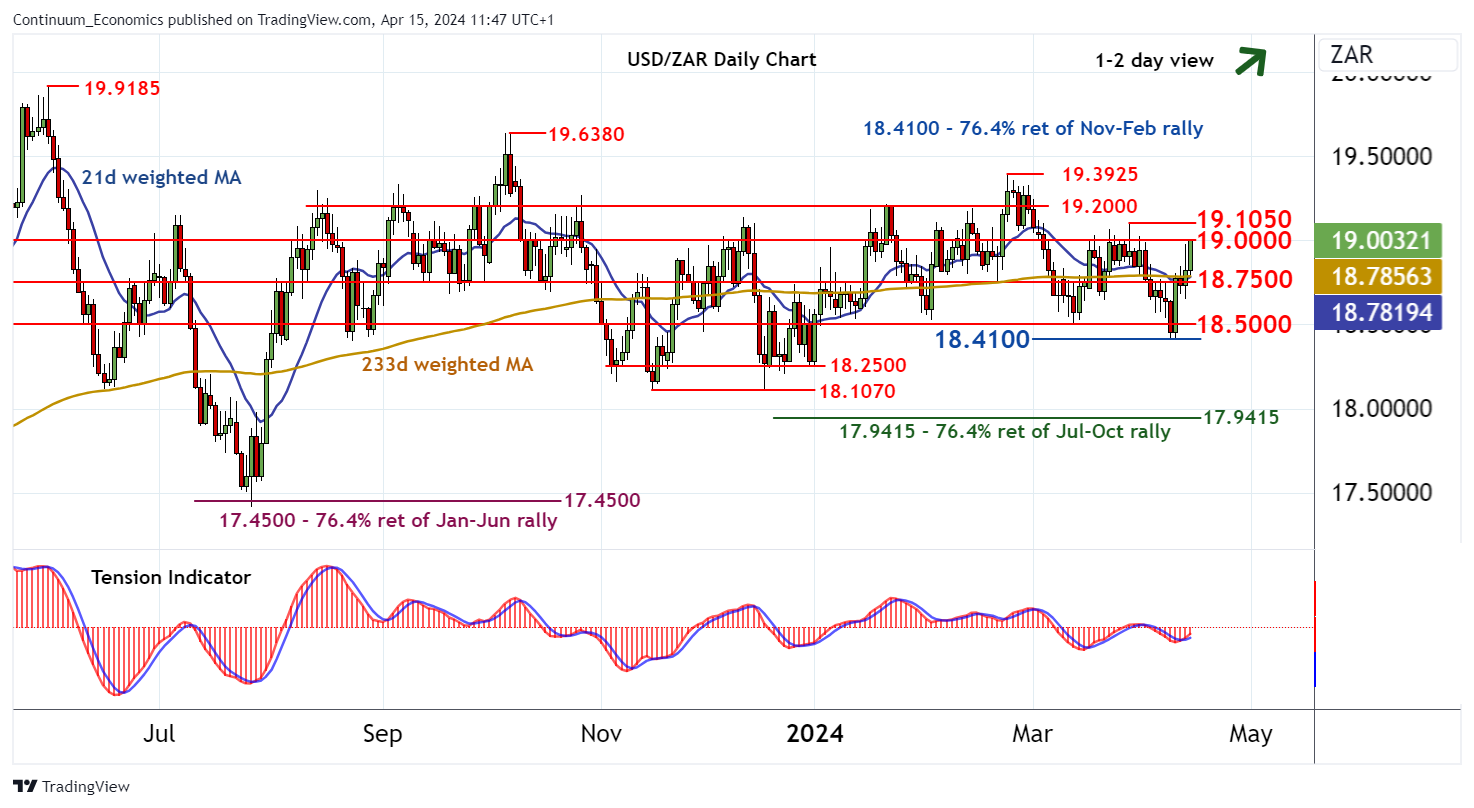
| Levels | Imp | Comment | Levels | Imp | Comment | |||
| R4 | 19.3925 | ** | 23 Feb YTD high | S1 | 18.7500 | * | congestion | |
| R3 | 19.2000 | break level | S2 | 18.5000 | ** | congestion | ||
| R2 | 19.1050 | * | 28 Mar (w) high | S3 | 18.4100 | ** | 76.4% ret of Nov-Feb rally | |
| R1 | 19.0000 | * | congestion | S4 | 18.2500 | ** | congestion | |
Asterisk denotes strength of level
13:30 BST - Consolidation has given way to the anticipated break higher, with prices currently pressuring congestion resistance at 19.0000. Daily readings are positive, highlighting room for a break above here. However, already overbought daily stochastics and mixed/negative weekly charts are expected to prompt profit-taking/consolidation towards stronger resistance at the 19.1050 weekly high of 28 March. A close above here, however, will turn sentiment outright positive and open up a test of 19.2000. Meanwhile, support remains at congestion around 18.7500 and should underpin any immediate tests lower. A close beneath here, if seen, will turn sentiment cautiously negative and open up a pullback towards further congestion around 18.5000.